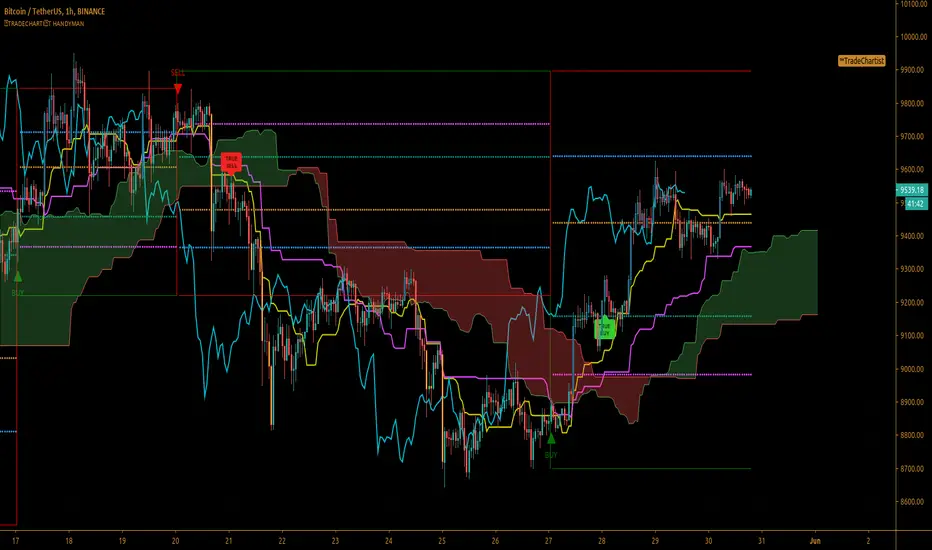
™ᴛʀᴀᴅᴇᴄʜᴀʀᴛɪꜱᴛ ʜᴀɴᴅʏᴍᴀɴ™ᴛʀᴀᴅᴇᴄʜᴀʀᴛɪꜱᴛ ʜᴀɴᴅʏᴍᴀɴ is a well designed utility script that helps plot a few important trading indicators like Bollinger bands, EMA , Ichimoku Cloud etc. along with repainting Buy/Sell signals based on Zig-Zag (Heikin Ashi trend) which can be used cautiously with levels generated.
What does ™ᴛʀᴀᴅᴇᴄʜᴀʀᴛɪꜱᴛ ʜᴀɴᴅʏᴍᴀɴ do?
Plots Bollinger Bands
Plots EMA
Plots VWMA and VWAP
Plots Ichimoku Cloud
Plots Zig-Zag based trade signals - Use with confirmation from other indicators above
---- CAUTION : Signals REPAINT as they are based on developing Zig-Zag
---- Option to plot Last True Non-Painted Signal label
---- Option to plot Fibonacci retracement levels to last known Zig-Zag high/low
based on highest/lowest of 2 trend changing up/down Heikin Ashi candles
---- Type of trade can be opted from indicator settings.
Plots RSI Color Candles
Note : This script is a good tool to get confirmations but Trade Signals cannot be used as definitive entry/exit points. This is the reason why there are no alerts coded for the signals.
Also, this script generates signals the same way as one of my first scripts, Alcides Indicator Lite, but has more trade options + more utilities to choose from indicator settings.
GBP-USD 1hr on Swing trade mode
Search in scripts for "Up down"
Market surfer 1 HourThis is 1 hour version only, using this script on lower/higher time frames will not work.
This is momentum indicator, which does not have a fixed baseline, the baseline moves with the trend.
The top oscillator features relative momentum, the bottom is the money flow.
The alerts search for convergence of the of the waves.
Background highlights indicate potential tops/bottoms.
How to read:
(1)- search for trending money flow- trending up/down.
(2)- if looking for longs, wait until quick momentum falls under the baseline, forming a green wave.
(3)- wait for a confirmation of quick momentum to enter.
(4)- surf responsibly.

NKP Trend Super FastNKP Trend super Fast is an indicator. It will plot buy / sell signal in live market based on custom calculated information about entry points at close of the candle. Buy/ Sell signal is the best entry point but you can enter at the next candle.
we can see signals like buy/sell/ - 5 min candle ( Intraday trading)
if the price move above the trend line and buy signal came then go for long if sell signal came below the trend line the go for short.
How does it work?
buy - take the buy order in next candle open's stop loss will be Trend line value or candle low which ever is least.
sell - take the sell order in next candle open's stop loss will be Trend line value or candle high which ever is highest.
What are the signals?
Yes it will generate the buy/sell signals in the live market
these signal will plot up/down label with text based on signal.
Can we set the Alert on this?
Yes, we can set the alert based on the signals
Four custom alerts - NKP Buy , NKP Sell
IMPORTANT: this script does not generate exit signals and those should be find using money management rules or else. Perfectly catches long runs in trends at all underlings (stocks, indexes ) at 5 min time frame. Lower/High period gives more incorrect signals and shorter runs on below 5 min period , higher period gives you late entry and less. Of course it gives false signals from time to time but fortunately it makes a correction very fast.
Try it! Good luck and good trading!


Indian Market OutlookIndian Market Outlook provides an information Panel for Major Nifty Indices, Indicators and the status of your stock time frames 2,5,15,30,60 minutes in one window.
It provides Up/Down Trend of the NIFTY & Other Indices.

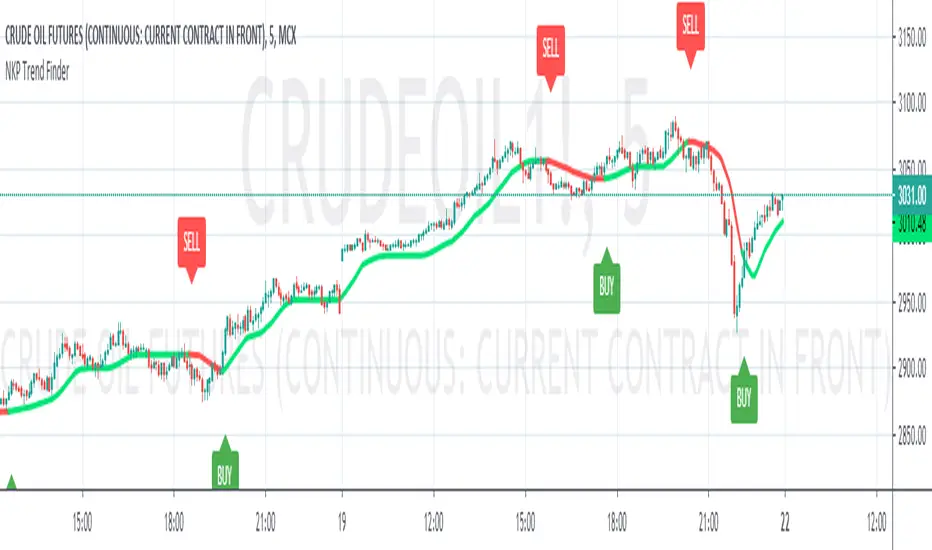
NKP Trend FinderNKP Trend Finder is an indicator. It will plot buy / sell signal in live market based on custom calculated information about entry points at close of the candle. Buy/ Sell signal is the best entry point but you can enter at the next candle.
we can see signals like buy/sell/ - 5 min candle (Intraday trading)
if the price move above the trend line and buy signal came then go for long if sell signal came below the trend line the go for short.
How does it work?
buy - take the buy order in next candle open's stop loss will be signal candle low
sell - take the sell order in next candle open's stop loss will be signal candle high
What are the signals?
Yes it will generate the buy/sell signals in the live market
these signal will plot up/down arrow based on signal.
Can we set the Alert on this?
Yes, we can set the alert based on the signals
Four custom alerts - NKP Buy , NKP Sell
IMPORTANT: this script does not generate exit signals and those should be find using money management rules or else. Perfectly catches long runs in trends at all underlings (stocks, indexes ) at 5 min time frame. Lower/High period gives more incorrect signals and shorter runs on below 5 min period , higher period gives you late entry and less. Of course it gives false signals from time to time but fortunately it makes a correction very fast.
Try it! Good luck and good trading!
JNARZZZ SCALPER STRATEGY v1.0Uses 4 EMAs from Philikone to create entry / exit points.
Trade entry / exit under the following conditions:
-Entry Signal (Up/Down Arrow)
->
-VWAP Break in the direction we are looking to trade the indicator
->
-Support / Resistance break in the direction we are looking to trade the indicator
-ENTRY
-Exit under your own personal risk or wait for indicator arrow in the opposing direction.

Megalodon Pro ScalperIt is designed to find scalping opportunities. It combines Megalodon Pro Shorter Term Trader and another momentum tool to enter and exit positions.
Usage
Follow the green and red color changes to buy and sell, respectively. You may also set your alarms and start automate your trading via alarms.
Settings
Setting 1 defines the trend. Possible options are up, down, sideways. Default: "Sideways"
Setting 2 defines how many bars to wait for looking for a momentum buy or sell signal after a buying opportunity has been found in Megalodon Pro Shorter Term Trader to enter or exit. Default: 16 bars to look after
Setting 3 defines time frame to look for a buy and sell signal. This setting is used for setting up alarms. Default: 15 bars
Enlightening the modern investors
~Bo Bugra Sukas
Use the links below at the signature part to get access to these indicators.

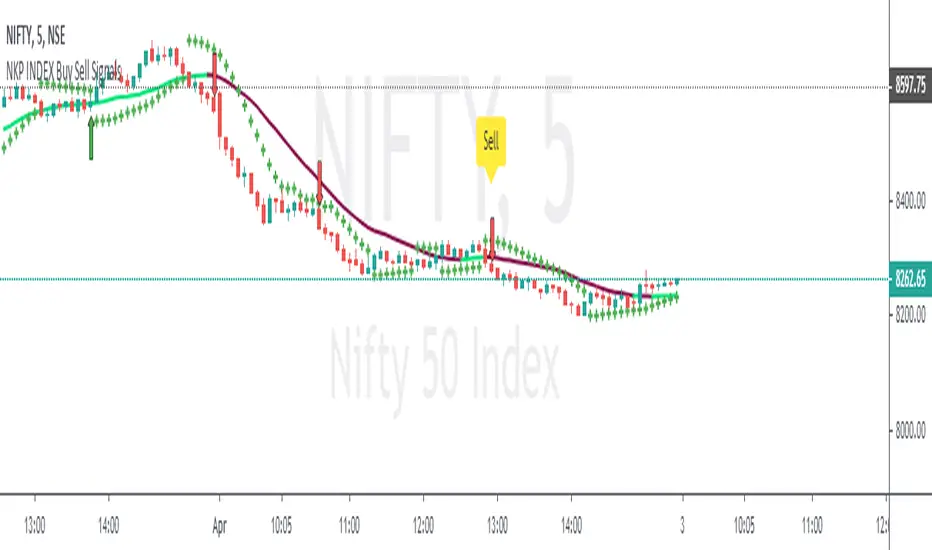
NKP Buy Sell Signals- INDEXNKP Buy Sell signal is an indicator. It will plot buy / sell signal in live market based on EMA , VWAP , RSI , PSAR, MACD generates information about entry points at close of the candle. Strong Buy/ Sell signal is the best entry point but you can enter at the next candle.
it will give good signals on index- NIFTY, BANK NIFTY
we can see signals like buy/strong buy or sell/strong sell - 5 min candle
if the price above the VWAP and SMA20 lines and buy signal came then go for long if sell signal came below the VWAP and SMA20 line the go for short.
How does it work?
buy - take the buy order in next candle open's stop loss will be signal candle low
strong buy - take the buy order in next candle open's stop loss will be signal candle low
sell - take the sell order in next candle open's stop loss will be signal candle high
strong sell- take the buy order in next candle open's stop loss will be signal candle high
What are the signals?
Yes it will generate the buy/sell/strong buy/strong sell signals in the live market
these signal will plot up/down arrow based on signal.
Can we set the Alert on this?
Yes, we can set the alert based on the signals
Four custom alerts - NKP Buy , NKP strong Buy , NKP Sell, NKP Strong Sell
IMPORTANT: this script does not generate exit signals and those should be find using money management rules or else. Perfectly catches long runs in trends at all underlings (indexes ) at 5 min time frame. Lower/High period gives more incorrect signals and shorter runs on below 5 min period , higher period gives you late entry and less. Of course it gives false signals from time to time but fortunately it makes a correction very fast.
Try it! Good luck and good trading!
For access, please PM us or visit the link below in our Signature.
NKP Buy Sell SignalsNKP Buy Sell signal is an indicator. It will plot buy / sell signal in live market based on EMA , VWAP , RSI , PSAR, MACD generates information about entry points at close of the candle. Strong Buy/ Sell signal is the best entry point but you can enter at the next candle.
we can see signals like buy/strong buy or sell/strong sell - 5 min candle
if the price above the VWAP and SMA20 lines and buy signal came then go for long if sell signal came below the VWAP and SMA20 line the go for short.
How does it work?
buy - take the buy order in next candle open's stop loss will be signal candle low
strong buy - take the buy order in next candle open's stop loss will be signal candle low
sell - take the sell order in next candle open's stop loss will be signal candle high
strong sell- take the buy order in next candle open's stop loss will be signal candle high
What are the signals?
Yes it will generate the buy/sell/strong buy/strong sell signals in the live market
these signal will plot up/down arrow based on signal.
Can we set the Alert on this?
Yes, we can set the alert based on the signals
Four custom alerts - NKP Buy , NKP strong Buy , NKP Sell, NKP Strong Sell
IMPORTANT: this script does not generate exit signals and those should be find using money management rules or else. Perfectly catches long runs in trends at all underlings (stocks, indexes ) at 5 min time frame. Lower/High period gives more incorrect signals and shorter runs on below 5 min period , higher period gives you late entry and less. Of course it gives false signals from time to time but fortunately it makes a correction very fast.
Try it! Good luck and good trading!
For access, please PM us or visit the link below in our Signature.

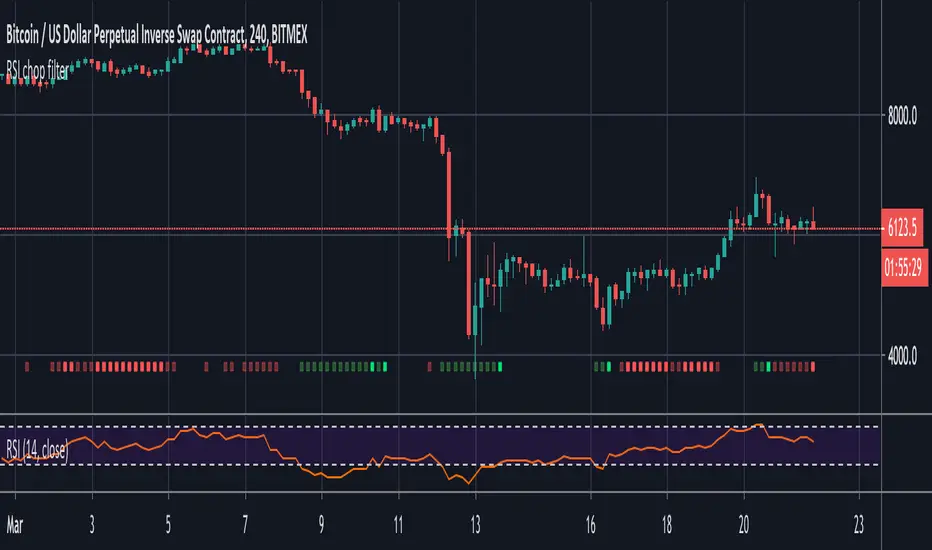
RSI chop filterThis demonstrates how you might filter your signals using RSI, but the same technique could be applied to Stochastic RSI and any other oscillator that has overbought and oversold conditions.
Use it as a visual indicator to determine when to enter a trade:
Red = Chop zone (no trade)
Bright red = Tight chop (dear god stay away)
Green = Overbought or oversold (signals permitted)
Bright green = Crossing up/down (take the trade)
To apply the filter, simply add 'and not chop' after your conditions as seen in the commented out example.
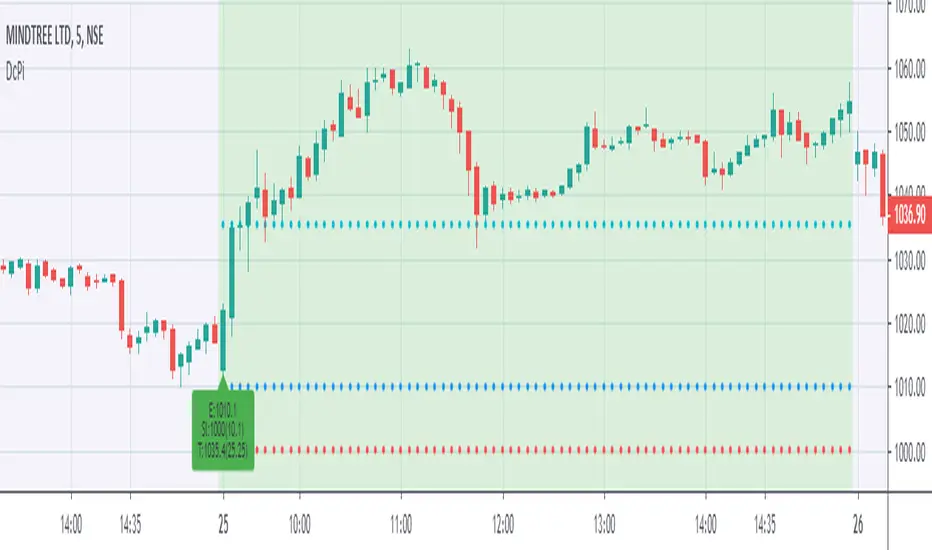
DcPi for intraday tradesDcPi stands for dark cloud and piercing , This is a very reliable pattern for intraday trades.
Precondition-
Whenever a big move is followed by gap(up/down) open next day.
Trade Setup-
Wait for price to enter in previous day range.
Aggressive traders can enter trade as soon as price enters previous day range, safe traders can wait for 1st 5 minute candle close, target can be mid of previous day range.
Trailing stoploss is a good way to secure your profits.
How this indicator helps?
Whenever intraday range will be more than 5% move, chart background will turn light blue, one might add stock to watchlist for next day.
if next day is gap open, chart background will be light green, and a textbox will be displayed with entry, stoploss and targets. One might take trades as explained in trade setup.
How it is dark cloud and piercing pattern?
Green candle followed by gap up open next day and closing in previous day range is Dark cloud on daily timeframe.
Red candle followed by gap down open next day and closing in previous day range is piercing pattern on daily timeframe.
Larsson AcademyThe L.A. Indicator supports:
- Trend trading (not range trading) of
- Tech assets, such as tech stocks and bitcoin/cryptocurrencies (not commodities) over
- Long timeframes, e.g. daily, weekly and monthly candles (not hourly candles or less).
By distilling all data down to one of 3 states, up, down or inconclusive, the indicator can aid in the decision making over long time periods, together with a rule based trading process. It works by measuring trend consistency.

Sequentially Filtered Moving AverageThe previously proposed sequential filter aimed to filter variations lower than a certain period, this allowed to remove noisy variations and retain only the closing price values that occurred after a consecutive up/down, however because of the noisy nature of the closing price large filtering was impossible, in order to tackle to this problem the same indicator using a simple moving average as input is proposed, this allow for smoother results.
We will see that the proposed indicator can provide an alternative moving average that could be used as slow moving average in crossover systems.
The Indicator
The length parameter as the same function as the one described in the sequential filter post, however here length also control the period of the moving average used input, in short larger values of length will return a smoother but less reactive output.
In blue the moving average with length = 200, and in red the moving average with length = 50.
It is interesting to see how the moving average remain flat during ranging/flat market periods
Unfortunately like the sequential filter the sequentially filtered moving average (SFMA) is not affected by large short term variations such as gaps or short term volatile events. This is because of the nature of the sequential filter to ignore movements amplitude and only focus on the variation period.
Moving Average Crossover System
The SFMA is equal to a simple moving average of period length when a consecutive up/down sequence of size length has occurred, else the SFMA is equal to its precedent value, therefore we could expect less crosses between a fast moving average and the SFMA as slow moving average.
We can see on the figure above that the fast moving average of period 50 (in green) cross more with the slow moving average of period 200 (in red) than with the SFMA of period 200 (in blue).
Crosses can occur at the same time as with the classical slow moving average (in red) or a bit later.
Conclusion
A new moving average based on the recently proposed sequential filter has been proposed, it can be seen that under a moving average crossover system the proposed moving average seems to be more effective at producing less crosses without necessarily doing it with an excessive lag, in fact the moving average has either lag (length-1)/2 or lag length .
In the future it could be interesting to provide an hybrid alternative that take into account volatility as well as variations period.
Thanks for reading !

Price Streak Is Another Way to Spot TrendsPrice is never wrong, but sometimes reading it can be tricky.
Movements in the broader market or a sector can distract from a symbol that's been steadily trending in one direction or another. Sometimes the beginning of a move can also be so subtle that it flies under most people's radar.
Price Streak can help overcome these limitations by tracking consecutive up/down periods. It plots an easy-to-read color-coded histogram.
Because it simply counts the candles in a trend, Price Streak can give a clearer picture than magnitude-biased indicators like relative strength or MACD.
Applying Price Streak to the daily chart of Bitcoin Dominance , we find something very interesting right now: the longest drop since March 2017.
That moment in history, almost three years ago, marked the beginning of the last Altcoin bull market. Ethereum , for example, went from roughly $60 to over $1,300 in the following nine months.
While past performance isn't a guarantee of future results, this illustrates how sustained price moves can reveal changes in character.
Based on Price Streak's current reading, it may support the idea of another Altcoin cycle beginning now.

Hull Signal and Auto Fib 30 secThis script will not be given away for free. Been months of developing and the effort is paying off.
The code uses a 40 HULL MA on the 30 second chart to identify up/down changes in trend. It ensures the equity is positive on the day to go long, or negative on the day to go short.
It draws the stop and fib lines according to the current 3 min ATR over the last 4 periods (12 minutes) : x1 x2 x3 x4 x6
Candles are highlighted upon entries. Grid begins.
Code resets upon one of the following:
- 4x target achieved and the trade has been active for 30 minutes
- 6x target achieved
- Stop hits
- 30 minutes have lapsed and the close is less than target x2
I have performed simple strategy analyses and have determined:
(Approximately)
34% lose x1
66% achieve 1:1, manually stop out at B/E after first target hits
48% achieve 2:1, manually stop out above B/E after x2 target hits
38% achieve 3:1, manually stop out above x1 after x3 target hits (will reset fib grid without change in trend)
13% achieve 4:1, manually stop out above x3 after x4 target hits (will reset fib grid without change in trend)
I have not evaluated for x6 though it expected to be around 5% of the winning trades. (will reset fib grid without change in trend)
Message me if your interested further.
